Soil Greenhouse Gas Monitoring- California State University at Monterey Bay
Since March 2011, we have monitored emissions of the three main greenhouse gases, carbon dioxide (CO2), methane (CH4), and nitrous oxide (N2O), from treatments 1A (low nitrogen inputs) and 2A (high nitrogen inputs) at the Mother Trial, and baby trial sites at ALBA and High Ground Organics. We have sampled from all the farms through subsequent crops and incorporation of crop residues through the end of the cover crop in spring 2014 (Figure 1), except we did not collect samples during the cauliflower crop in 2013.


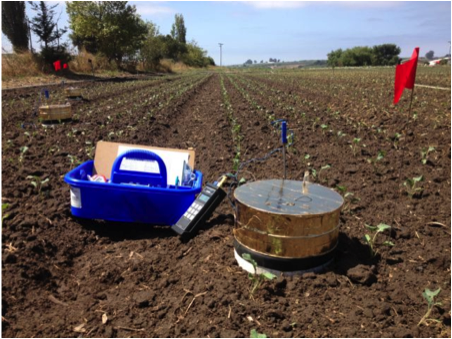
Figure 1. GHG monitoring using vented static chambers at the Mother Trial (left), Baby-2 (center), and Baby-3 (right).
We measured soil gas emissions using static gas chambers that we fabricated in our lab. These types of chambers are used all over the world for soil GHG monitoring. We made our chambers from both 8” and 10” diameter PVC pipe, and they include two main components: a base that is inserted into the soil (Figure 2), where it remains until farm management activities require temporary removal; a cap, which is covered in reflective tape and includes a vent port for ensuring equal pressure inside and outside the chamber, a sampling port with a septum, as well as a thermistor for measuring internal chamber temperature during monitoring. During sample collection, the cap is attached to the base for a 45 minute sampling period during which 4 discrete gas samples are collected at times 0, 15, 30, and 45 minutes; samples are collected by injecting a syringe into the septum port in the cap, extracting a sample, and transferring the sample to a pre-evacuated glass vial. Back in our lab, samples are analyzed on a gas chromatograph, giving results for the concentrations of CO2, CH4, and N2O, and GHG fluxes are determined through …
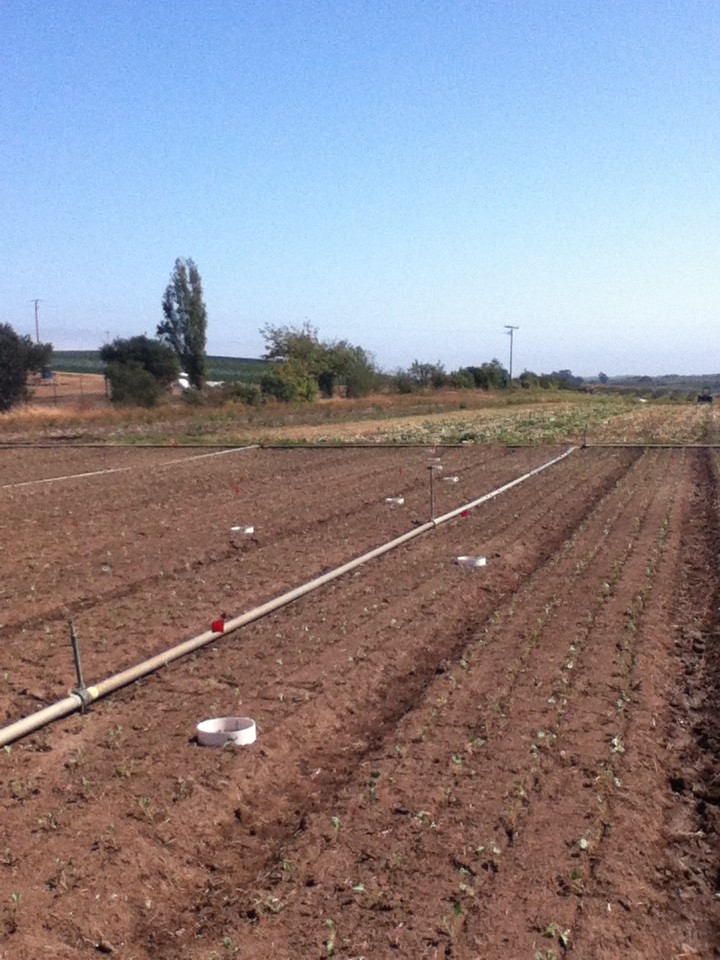
Figure 2. Chamber bases at Baby-2 site. In each treatment we randomly placed 8 chamber bases 8 cm into the soil, and left them in place throughout a sampling period unless management activity required temporary removal.
In addition to GHG sample collection, we also collected soil samples and processed them in our lab for nitrate+nitrite, ammonium, pH, redox and soil moisture, which are known drivers of N2O emissions. Additional factors influencing on-farm GHG emissions, particularly N2O emissions, include available soil carbon, soil organic carbon (SOC) content, nitrogen input types and amounts, irrigation practices (e.g. type and volume of application), and plant N and biomass for incorporated residues. Thankfully, other collaborators on this study collected samples and processed data for those variables, and we are looking forward to examining and interpreting GHG emissions with those data.
The following project goals reflect how monitoring GHGs fits into the context of the overall project:
-
Evaluate the performance of crop rotations and management strategies designed to meet the combined goals of high yields, reduced disease levels, provision of adequate N with minimal environmental impacts and improved C-sequestration.
-
Compare the effects of 4-year vegetable/strawberry rotations with varying fertility on denitrification (nitrous oxide emissions), and methane and carbon dioxide emissions.
Our work on this project also facilitated a teaching component, including field and lab experience, for students of the Soils and the Environment class at CSUMB (Figure 3). In spring of 2012 and 2013 students from this class were led in a field sampling event to learn monitoring techniques for soil GHG emissions, and followed up with in-class lectures on data analysis and interpretation, as well as application and implications of results. These experiences piqued the interest of several students, and resulted in paid internships by external funding sources for these students to become technicians who helped in the data collection and processing for the Cal-CORE project. Additionally, we have had over a dozen undergraduate and graduate students work on our team to collect, process, and analyze data for this project.
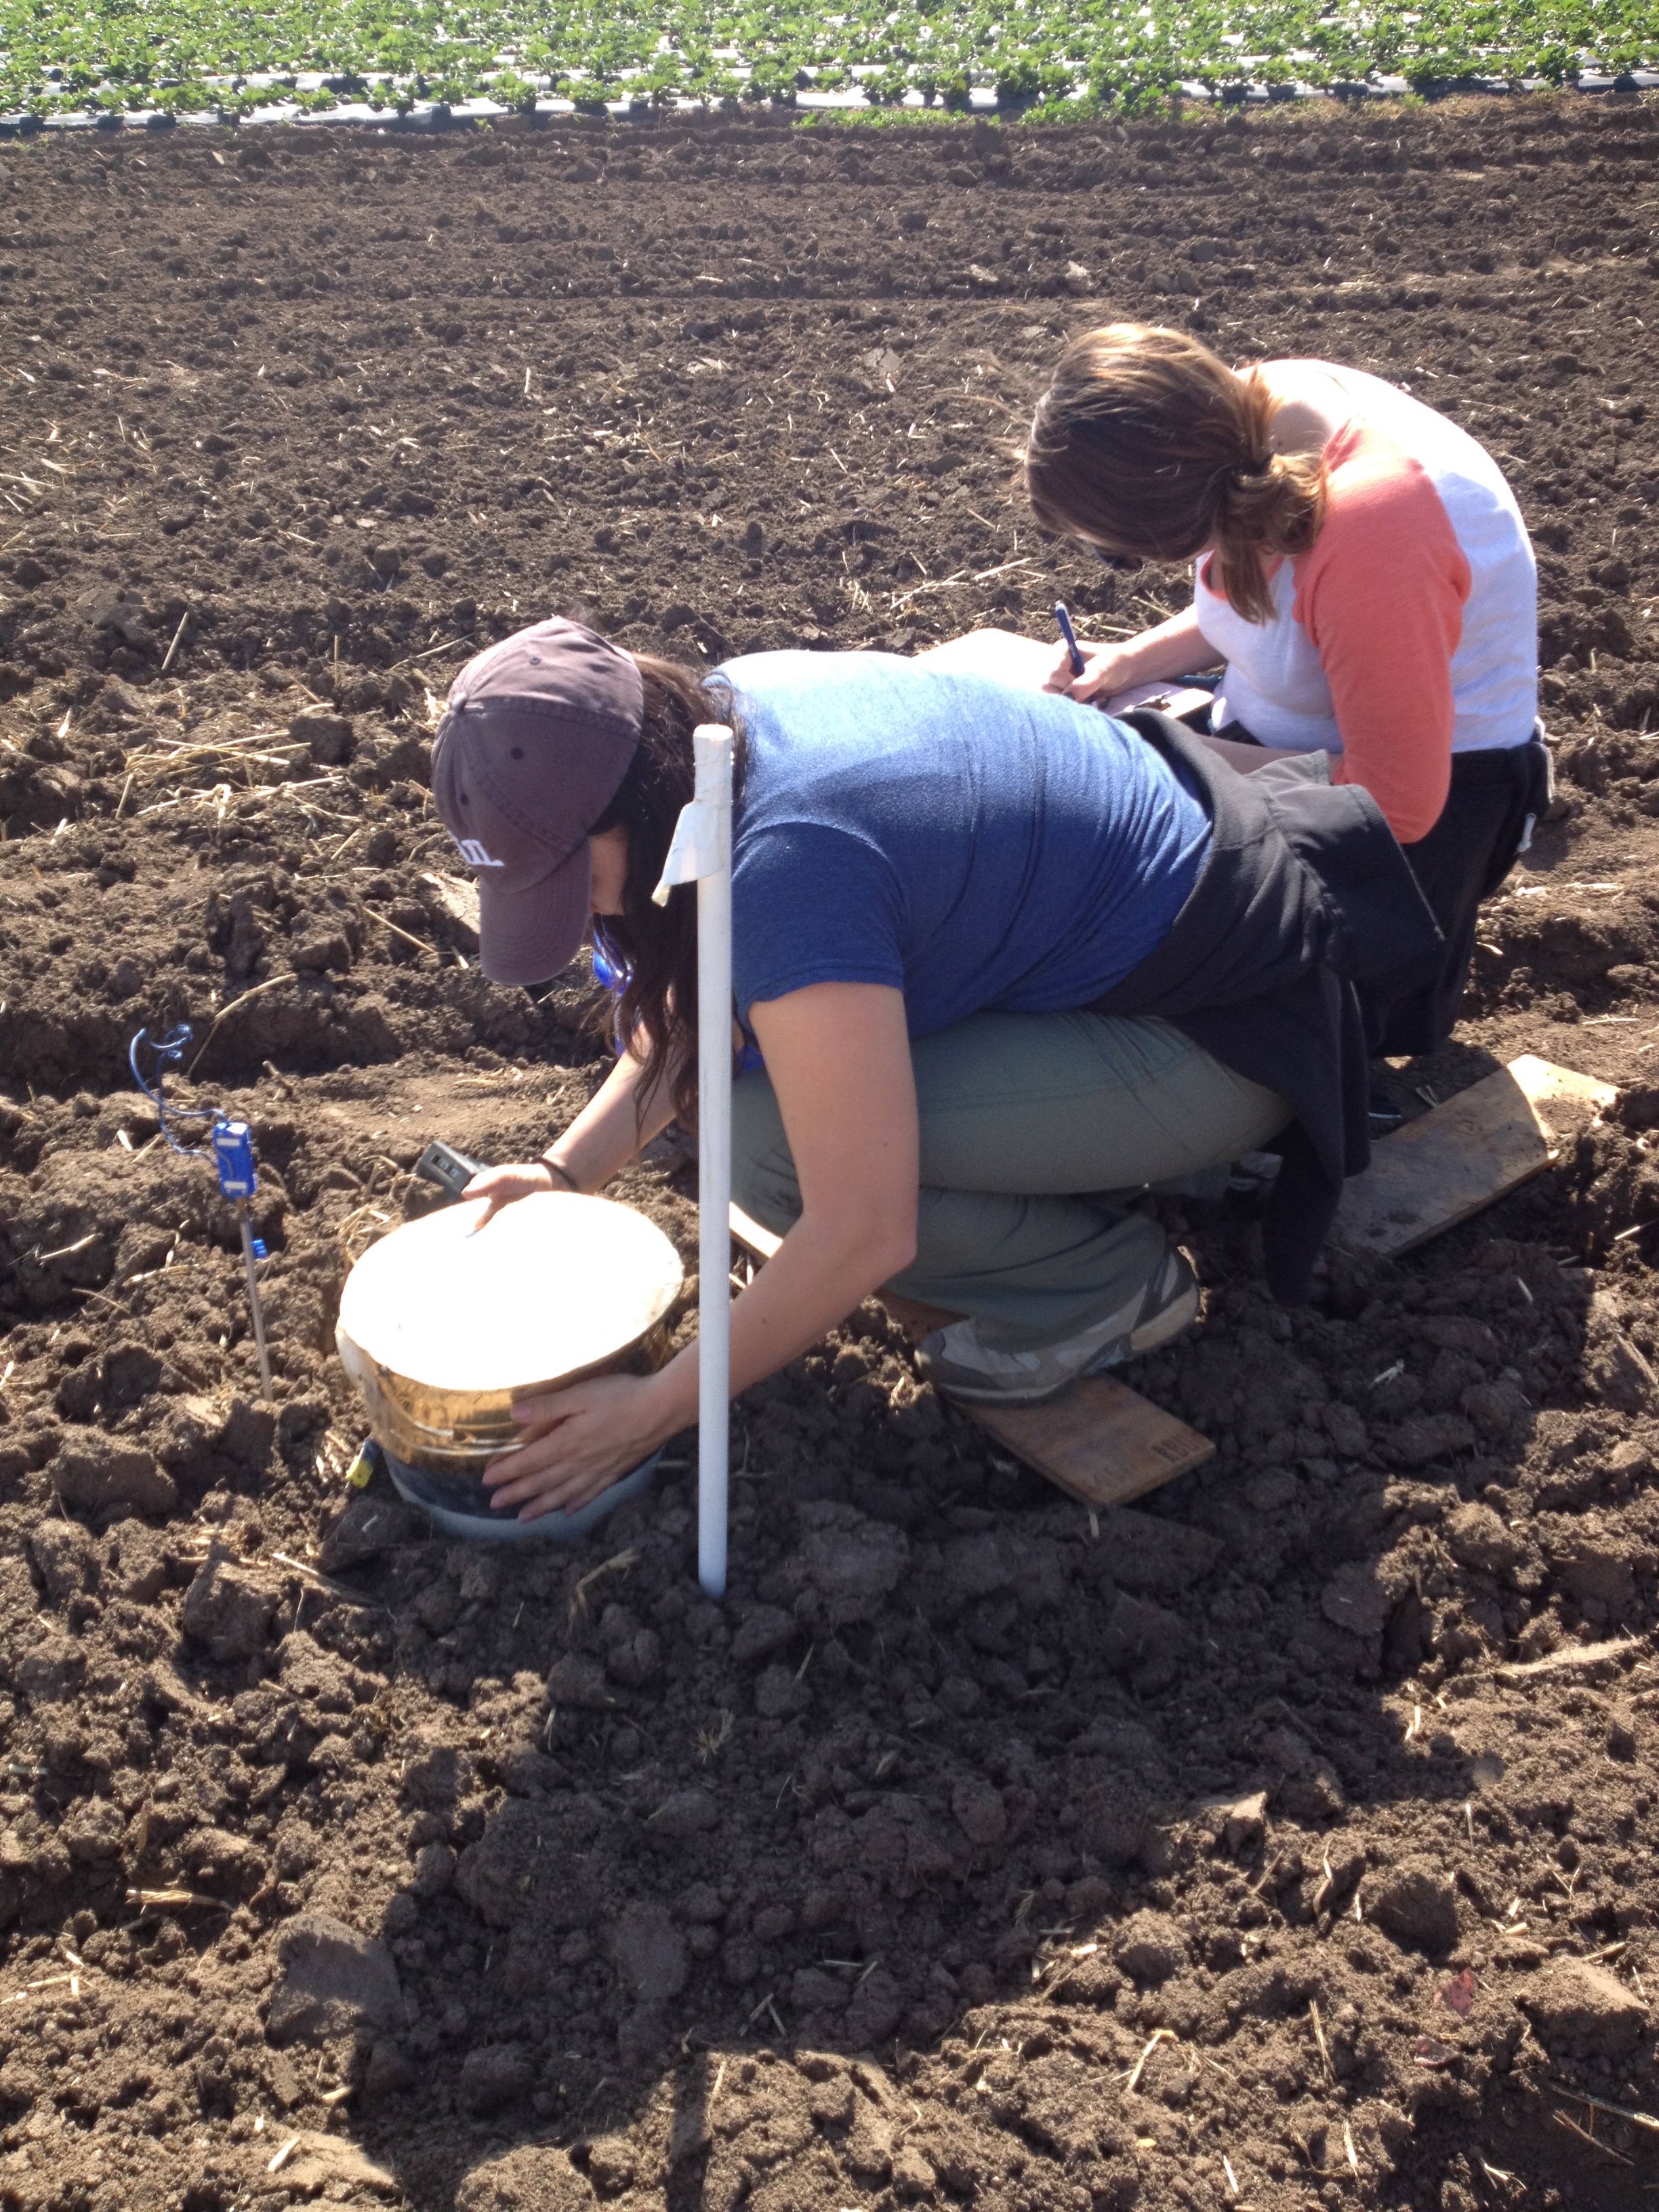
Figure 3. Students from the CSUMB Soils and the Environment class engaging in field sampling of soil GHG emissions for a class lab.
While we are still completing analysis of our gas data, some trends in N2O emissions that we’ve observed in the data so far include:
-
Across sites, seasonal average N2O emissions ranged from 2 to 14 times greater after cover crop incorporation compared to emissions during the crop period.
-
Treatment-specific emissions differences across sites starting with the lettuce crop in 2013, and continuing through subsequent sampling periods (lettuce incorporation, cauliflower incorporation, cover crop) into 2014. During this time period, treatment 2A shows a much higher overall range of emissions to 1A, and peak emissions during specific sampling periods for treatment 2A range from 2 to 4 times greater than treatment 1A.
We are looking forward to completing the remainder of our GHG analysis this Fall (2015), and will update this information with our findings.
If you are interested in learning more, or have any question, please contact Stefanie Kortman at skortman@csumb.edu.